Viewing production timing and schedule in Scheduler:
-
The left side of the Scheduler screen is a textual description, while the right side is a graphical representation (Gantt chart) of the production schedule. Click and drag on the vertical lines in the table to increase and decrease column widths. The following gives a brief description of each option in the CIM Scheduler toolbar:Previous Index Next
1.
 Sort by Machine: Shows the activities of machines and the parts they process.
2.
 Sort by Part: Shows the progress of parts, and the machines which process them.
3.
Zoom: Value of time interval compression in Gantt chart display.
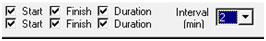
Show: Checked items are displayed in the textual display.