General Information
Evaluation of signal parameters for user defined functions. Experiment is carried out LabVIEW 8.5 software and this can be run in LabVIEW 8.5 or higher versions.
1. The front pannel of this experiment is divided in two panels.
a. Input panel - to input the required data along with input signal display (bottom pane).
b. Output panel - to displaying the output parameters.
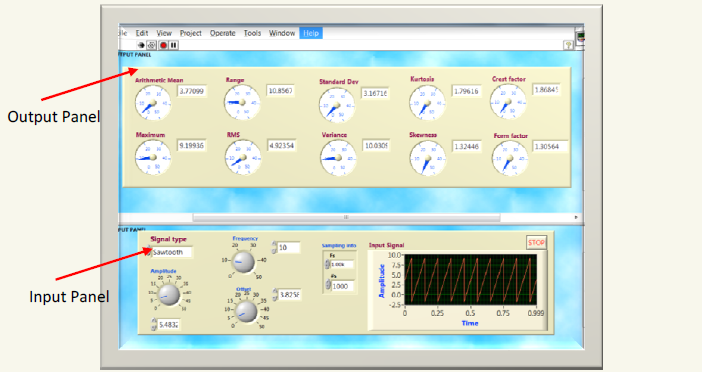
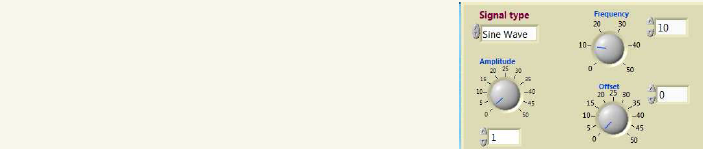
2. Required signal can be choosen from used defined function from Signal type box button in input panel.

3. After selection of required signal type, the important input parameters such as amplitude, frequency and offset for a signal should be inputted through dial gauges as shown in fig. Note this dial gauges shows that default max input is 50. For the higher values to be input, simply enter in white box(digital indicator) which is attached to the dial gauge.
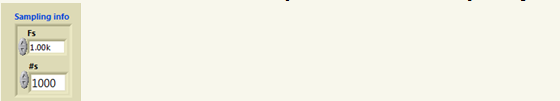
4. To generate a sample, we should follow the sampling theorem i.e, the frequency of the signal must be greter than or equal to half of the sampling rate Fs(samples per second) whch is provided in sampling information box. The default value 1k which is equal to 1000.#s is the number of samples in a signal.
5. The signal which is obtained from required input can be displayed in input signal graph which is provided in input panel.

6. Afters required parameters are input, the experiment to run by pressing run button which is provided in menu tool bar.

7. After pressing stop button in input panel or pressing red button in menu tool bar, the experiment can be stopped.
8. Observations can be noted by varying the parameters in input panel.