Objectives
This experiment can be used to measure the basic parametes of signal in frequency domain
1. Amplitude Spectrum
2. Real and Imaginary Spectrum
3. Power Spectrum
4. Power Spectral Density
Introduction
The fundamental problem for many engineers and scientists is the analysis of electrical signals. Even if the basic problem is not electrical, the basic parameters of interest are often changed into electrical signals by means of transducers. The frequently used transducers are accelerometers and load cells in mechanical field, EEG electrodes and blood pressure probes in biology and medicine, and pH and conductivity probes in chemistry. The advantages for transforming physical parameters to electrical parameters are more due to many instruments are available for analysis of electrical signal in time and frequency domain. The powerful measurement and analysis capabilities of these instruments can lead to rapid understanding of the system under study.
In this experiment, we are introducing the basic concepts of the time and frequency domains. The information in one domain can be interchangeable from one domain to another domain without losing any information. By changing the prospective from time domain to frequency domain, the solution to the difficult problems often become quite clear.
The traditional way of observe is to view them in the time domain. The time domain is a record of what happened to a parameter of the system versus time. For instance, in a RC circuit the signal may represent the voltage across the capacitor or the current flowing in the resistor with sequences of time. There are lot of ways to records the variable which is to be measured with time. Figure 1 shows direct and indirect recording of displacement of mass of a simple spring mass system. The resulting graph is a record of the displacement of the mass versus time, a time domain view of displacement.
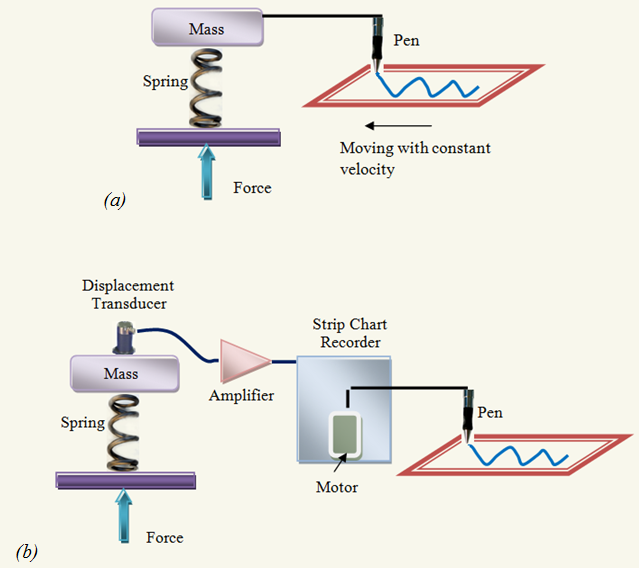
Fig. 1: (a) Direct and (b) indirect representation of displacement in time domain
These sort of direct recording schemes are sometimes used; by using the transducers, the conversion of the parameters of interest to electrical signal is more practical. Now a day's transducers are frequently using in variety of applications. Pressure and temperature probes, microphones, load cells and accelerometers are few examples.
Mathematically, a signal, usually is represented as a function of an independent variable time, t. Thus, a signal is denoted by x(t). There are lot of instruments are data gathering system can represents the signals where as oscilloscope is the most common one. For instance consider a sinusoidal signal obtained from oscilloscope can be represents in following form
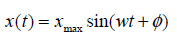
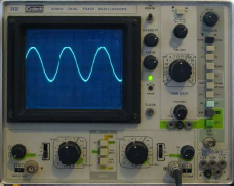
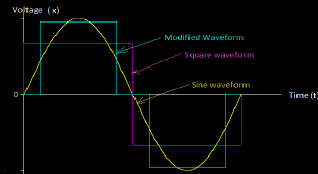
Fig 2: Representation of different time domain signals obtained from oscilloscope
Hundred years ago Baron Jean Baptiste Fourier shown that any waveform that exists in the real world can be generated by addition of two sine waves. Conversely, we can break down our real world signal into these same sine waves. It can be shown that this combination of sine waves unique; any real world signal can be represented by only one combination of sine waves.
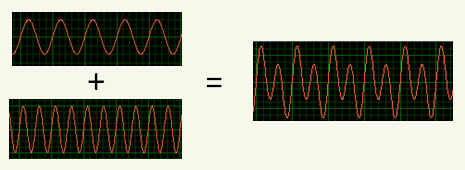
Fig 3: Any real waveform can be produced by adding sine waves together
In time domain, the axes are time and amplitude. For given real waveform can be composed into two sine waves which allow us to visualize in third axes as frequency in three dimensional graph as shown in figure 4. This visualization of wave height i.e. amplitude of sine waves with respect to frequency is commonly called as frequency domain. Each line in frequency domain represents a line which has uniquely characterized our input signal. This frequency domain representation of our signal is called spectrum of signal. Each sine wave line of the spectrum is called a component of the total signal.
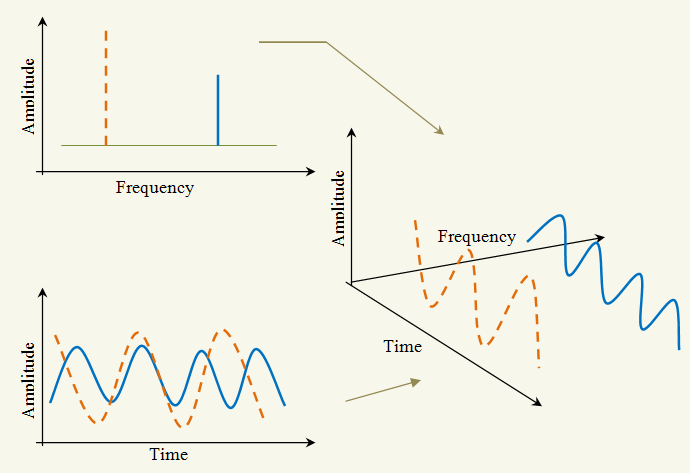
Fig 4: The relationship between the time and frequency domain
Source: The Fundamentals of Signal Analysis, Application Note 243, Agilent Technologies