General Information
1. Evaluation of signal parameters for user defined functions. Experiment is carried out LabVIEW 8.5 software and this can be run in LabVIEW 8.5 or higher versions.
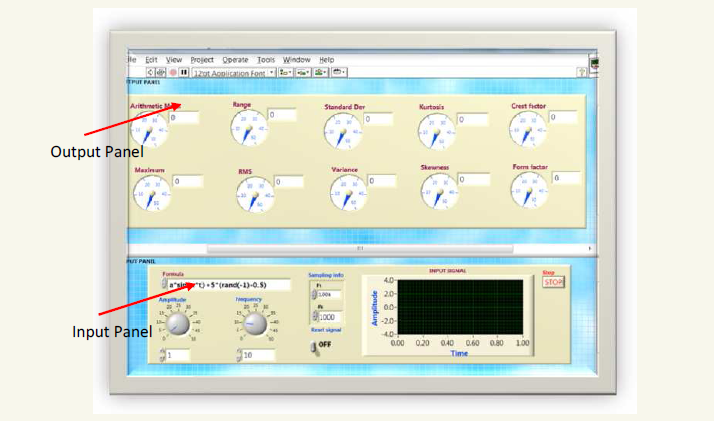
2. The front pannel of this experiment is divided in two panels.
a. Input panel - to input the required data along with input signal display (bottom pane).
b. Output panel - to displaying the output parameters.
3.The required mathematical formula is to be written in Formula box provided in input panel.
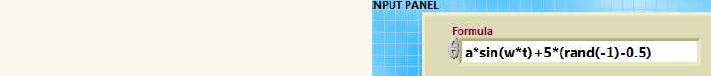
4. All variable names are not allowed, the allowed variable names are w, f, t, a, fs or n.These variables are referred to the following parameters.
w = frequency
f = frequency rate
t = sampling time
fs = sampling frequency
n = number of samples
π is represented in the form of pi(1)
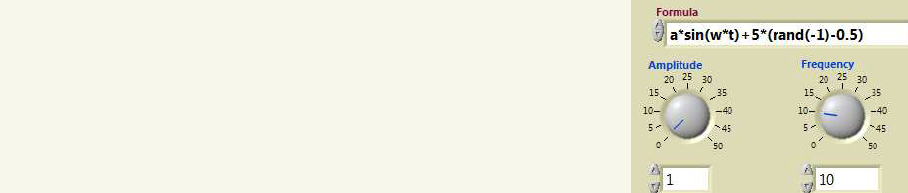
5. After writing the required mathematical formula of signal, the important parameters which are amplitude, frequency for a signal should be inputted through dial gauges as shown in fig. Note this dial gauges shows that default max input is 50. For the higher values to be input, simply enter in white box (digital indicator) which is attached to the dial gauges.
6. To generate a sample, we should follow the sampling theorem i.e, the frequency of the signal must be greter than or equal to half of the sampling rate Fs(samples per second) whch is provided in sampling information box. The default value Fs is 1k which is equal to 1000.#s is the number of samples in a signal.

7. The continuous signal generated in the time interval t with #s samples. The default value of time interval is 1 i.e, ratio of sampling frequency to number of samples. The system continuously changing the starting time of interval with incremental of 1. The signal produces with 1000 samples as defaults. To reset the signal generation to make a constant time stamp, switch on the reset signal button. It makes the initial tome as zero and end time is 1 with 1000 sampling points.

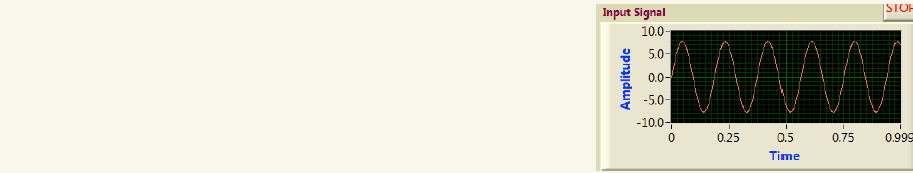
8. The signal which is obtained from required input can be displayed in input signal graph which is provided in input panel.
Afters required parameters are input, the experiment to run by pressing run button which is provided in menu tool bar.

7. After pressing stop button in input panel or pressing red button in menu tool bar, the experiment can be stopped.
8. Observations can be noted by varying the parameters in input panel.