Results and Discussion
The results are discussed below according to the analysis of FFT and time domain of both the vibration and current signal.
FFT analysis of vibration signals
From the vibration signal it was found that the first peak was at 24.75Hz (104 dB) which happens to be the rotational speed (RPS) of the pump. This measurement was verified by an optical tachometer i.e. RPM is 1485, which is same as 24.75 RPS.
By observing the vibration spectra of the four types of impeller, the following summary is presented in table 1.
Table 1: Specification of the gears
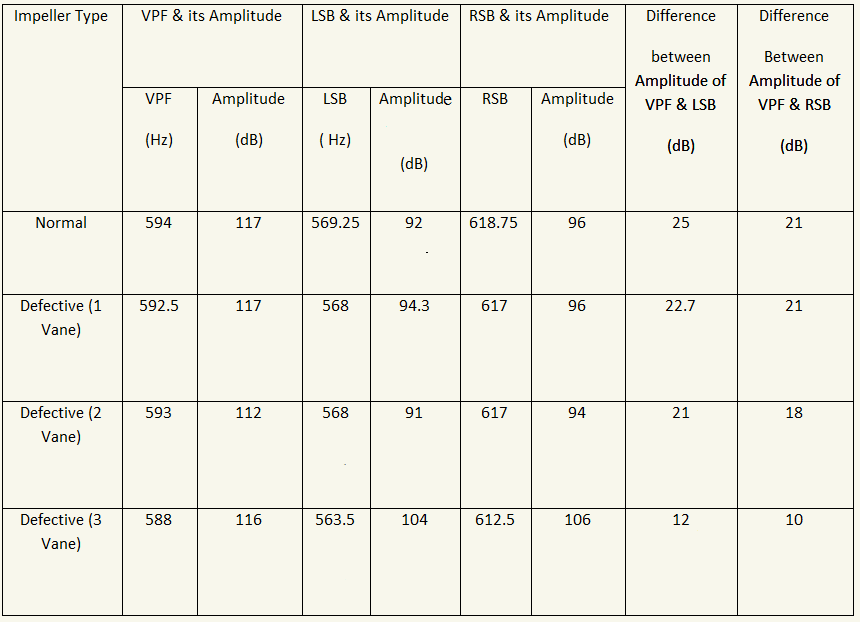
where LSB (Left side band) is VPF-rotating speed
where RSB (Right side band) is VPF+rotating speed
from the above table it is observed that when the severity of the defect increses, height of the sidebands (SB) increses and the difference between the dB values of VPF and SB's decreases.
Spectra of current signals
From the current spectrum, it was observed that the second (and highest) peak gives the supply frequency (in this case 50 Hz)
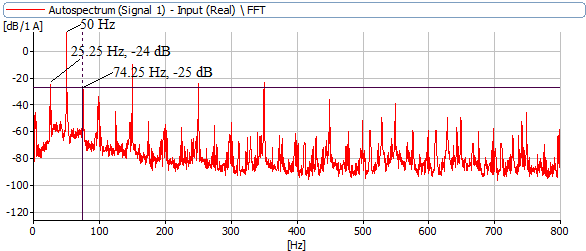
Also, the current spectrum has been used to find out the rotating speed (RPS). From the current spectrum it was observed that the peaks were found at supply frequency (50Hz) and two sidebands at 50 +/- RPS. These are 25.25Hz (-24dB) and 74.25Hz (-25dB) respectively.
Time domain analysis of vibration signals
The time domain data of the vibration signal (obtained from PULSE) has been used to find the RMS and Peak value for each case, using MATLAB, and were compared for different impellers.
Table 2: RMS (vibration signal)
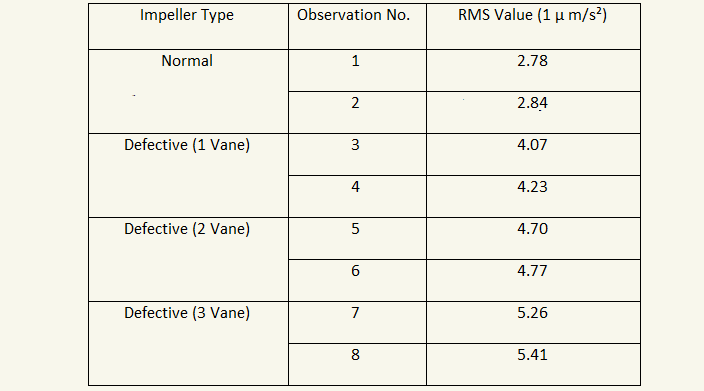
From the above table it is observed that the RMS value of vibration signal increases as the severity of the defect of impellers increases.
Table 3: Peak Value (vibration signal)
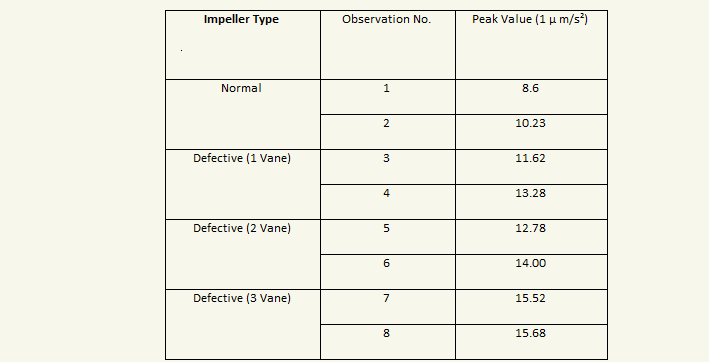
From the above table, it is observed that the peak value of the vibration signal increases as the severity of the defect of impellers increases.
Time domain analysis of current signals
By observing the modulated current spectra for the four types of impellers, the VPF was found out and their amplitudes were compared. MATLAB has been used for plotting the modulated current spectrum from the time domain data obtained from PULSE.
Table 4: Summary of the observations for the modulated current spectra showing VPF and its amplitude
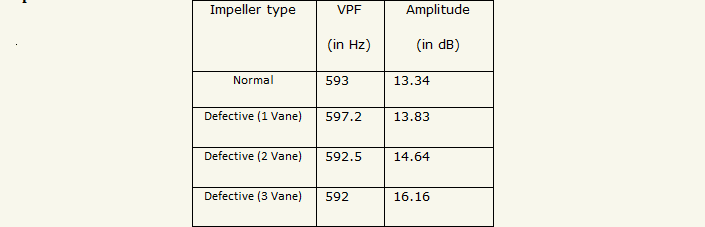
From the above table, it is observed that when the severity of the defect increases, then the amplitude of the current signal at VPF increases.